
Explain how the system works.
Draw routes, bend pipes, edit text in place, and arrange maps, gauges, and illustrations on a freeform canvas.
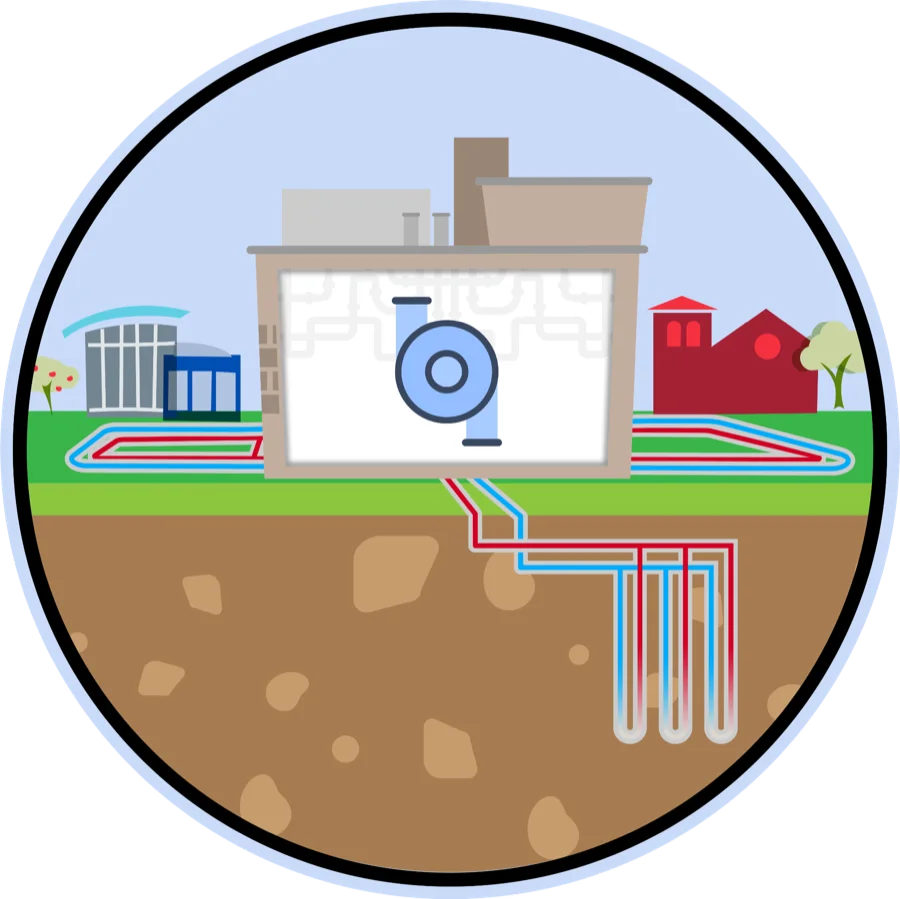
Read the geothermal storyDraw the pipes. Place the gauges. Connect live readings. Then publish the same canvas as an interactive story or a lobby loop.
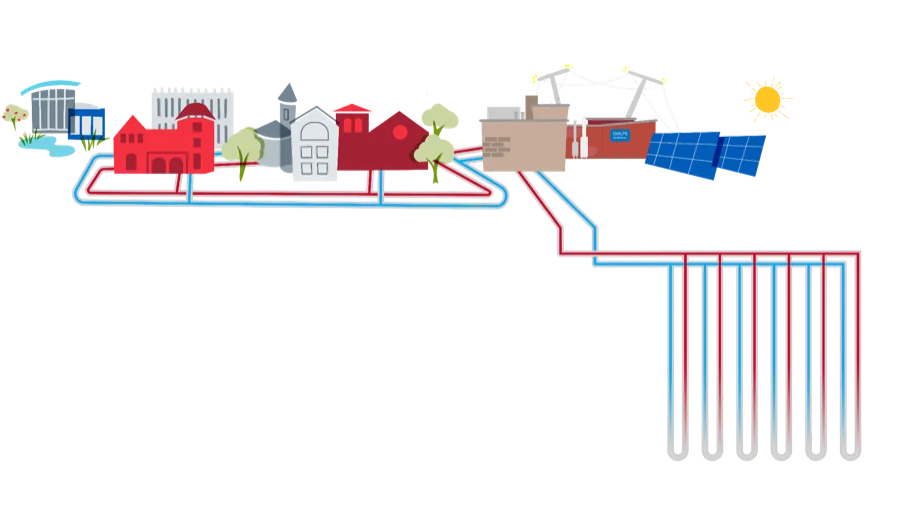
Map the place. Draw the system. Connect the data. Tell the story.
Build once, then let people explore the place, follow the explanation, or watch it unfold on a public screen.
Place live data where it happens, compare buildings and sensors, and keep the geography recognizable.
Explore a live mapDraw routes, bend pipes, edit text in place, and arrange maps, gauges, and illustrations on a freeform canvas.
Read the geothermal storySequence the same canvas scenes into a hands-free display that remains clear from across a lobby.
Watch a lobby loopStart with a campus, neighborhood, building, or sensor network.
Draw the connections, bind live readings, and arrange the story on canvas.
Share an interactive link or run the same work as a hands-free loop.
These are working maps, stories, and loops. Open any example and explore the published result.
No examples match that search.
“I really feel that I am a part of the resource use graphs displayed on the dashboards. This feeling motivates me to be more thoughtful when consuming water and electricity.”
“When you talk about 21st-century skills — gathering and interpreting data — the Dashboard will be a very important tool.”
“The dashboard signage is stitching together the work of Cleveland organizations to make the team effort apparent.”